Using ldmx-sw Directly
As you may be able to pick up based on my tone, I prefer the (efficient) python analysis
method given before using uproot, awkward, and hist. Nevertheless, there are two
main reasons I've had for putting an analysis into the ldmx-sw C++.
- Longevity: While the python ecosystem evolving quickly is helpful for obtaining new features, it can also cause long-running projects to "break" -- forcing a refactor that is purely due to upstream code changes.1 Writing an analysis into C++, with its more rigid view on backwards compatibility, essentially solidifies it so that it can be run in the same way for a long time into the future.
- Non-Vectorization: In the previous chapter, I made a big deal about how most
analyses can be vectorizable and written in terms of these pre-compiled and fast
functions. That being said, sometimes its difficult to figure out how to write
an analysis in a vectorizable form. Dropping down into the C++ allows analyzers
to write the
forloop themselves which may be necessary for an analysis to be understandable (or even functional).
This longevity issue can be resolved within python by "pinning" package versions so that all developers of the analysis code use the same version of python and the necessary packages. Nevertheless, this "pinning" also prevents analyzers from obtaining new features or bug fixes brought into newer versions of the packages.
The following example is stand-alone in the same sense as the prior chapter's jupyter notebook. It can be run from outside of the ldmx-sw repository; however, this directly contradicts the first reason for writing an analysis like this in the first place. I would recommend that you store your analyzer source code in ldmx-sw or the private ldmx-analysis. These repos also contain CMake infrastructure so you can more easily share code common amongst many processors.
Set Up
I am going to use the same version of ldmx-sw that was used to generate
the input events.root file. This isn't strictly necessary - more often
than not, newer ldmx-sw versions are able to read files from prior ldmx-sw
versions.
This tutorial uses a feature introduced into ldmx-sw in v4.0.1. One can follow the same general workflow with some additional changes to the config script described below.
cd work-area
denv init ldmx/pro:<ldmx-sw-version>
where <ldmx-sw-version> is a version of ldmx-sw that has been released. The version of ldmx-sw you want to use depends on what features
you need and input data files you want to analyze.
The following code block shows the necessary boilerplate for starting
a C++ analyzer running with ldmx-sw.
// filename: MyAnalyzer.cxx
#include "Framework/EventProcessor.h"

#include "Ecal/Event/EcalHit.h"

class MyAnalyzer : public framework::Analyzer {
 public:
  MyAnalyzer(const std::string& name, framework::Process& p)
    : framework::Analyzer(name, p) {}
  ~MyAnalyzer() override = default;
  void onProcessStart() override;
  void analyze(const framework::Event& event) override;
};

void MyAnalyzer::onProcessStart() {
  // this is where we will define the histograms we want to fill
}

void MyAnalyzer::analyze(const framework::Event& event) {
  // this is where we will fill the histograms
}

DECLARE_ANALYZER(MyAnalyzer);
And below is an example python config called ana-cfg.py that I will
use to run this analyzer with fire. It assumes to be in the same
place as the source file so that it knows where the files it needs
are located.
from LDMX.Framework import ldmxcfg
p = ldmxcfg.Process('ana')
p.sequence = [ ldmxcfg.processor_from_file('MyAnalyzer.cxx', needs=['SimCore_Event', 'Ecal_Event']) ]
p.input_files = [ 'events.root' ]
p.histogram_file = 'hist.root'
p.pause()
If you are using ldmx-sw < v4.7.0 (but >= v4.0.1), then the processor_from_file function
was named Analyzer.from_file but otherwise works the same.
Unable to Load Library
Unable to Load Library
If you see an error like the one below, you are probably not linking
your stand-alone processor to its necessary libraries.
The configuration script needs to be updated with needs listing
the ldmx-sw libraries that the stand-alone processor needs to be
linked to.
For example, this tutorial uses the Ecal hits defined in the
Ecal/Event area which means we need to add 'Ecal_Event' to
the needs list.
Example error you could see...
$ denv fire ana-cfg.py
---- LDMXSW: Loading configuration --------
Processor source file /home/tom/code/ldmx/website/src/using/analysis/MyAnalyzer.cxx is newer than its compiled library
 /home/tom/code/ldmx/website/src/using/analysis/libMyAnalyzer.so (or library does not exist), recompiling...
 done compiling /home/tom/code/ldmx/website/src/using/analysis/MyAnalyzer.cxx
 ---- LDMXSW: Configuration load complete  --------
 ---- LDMXSW: Starting event processing --------
 Warning in <TClass::Init>: no dictionary for class pair<int,ldmx::SimParticle> is available
 Warning in <TClass::Init>: no dictionary for class ldmx::SimParticle is available
 Warning in <TClass::Init>: no dictionary for class ldmx::SimTrackerHit is available
 Warning in <TClass::Init>: no dictionary for class ldmx::SimCalorimeterHit is available
 Warning in <TClass::Init>: no dictionary for class ldmx::HgcrocDigiCollection is available
 Warning in <TClass::Init>: no dictionary for class ldmx::EcalHit is available
 Warning in <TClass::Init>: no dictionary for class ldmx::CalorimeterHit is available

 ... proceeds to seg fault on getEnergy ...
A quick test can show that the code is compiling and running (although it will not print out anything or create any files).
$ denv time fire ana-cfg.py
---- LDMXSW: Loading configuration --------
Processor source file /home/tom/code/ldmx/website/ldmx-sw-eg/MyAnalyzer.cxx is newer than its compiled library /home/tom/code/ldmx/website/ldmx-sw-eg/libMyAnalyzer.so (or library does not exist), recompiling...
done compiling /home/tom/code/ldmx/website/ldmx-sw-eg/MyAnalyzer.cxx
---- LDMXSW: Configuration load complete  --------
---- LDMXSW: Starting event processing --------
---- LDMXSW: Event processing complete  --------
7.79user 0.74system 0:08.55elapsed 99%CPU (0avgtext+0avgdata 601516maxresident)k
264inputs+2480outputs (0major+223914minor)pagefaults 0swaps
MyAnalyzer needed to be compiled which increased the time it took to run.
Re-running again without changing the source file allows us to skip this compilation step.
$ denv time fire ana-cfg.py
---- LDMXSW: Loading configuration --------
---- LDMXSW: Configuration load complete  --------
---- LDMXSW: Starting event processing --------
---- LDMXSW: Event processing complete  --------
3.52user 0.14system 0:03.66elapsed 100%CPU (0avgtext+0avgdata 325828maxresident)k
0inputs+0outputs (0major+58137minor)pagefaults 0swaps
Notice that we still took a few seconds to run.
This is because, even though MyAnalyzer isn't doing anything with the data,
fire is still looping through all of the events.
You do not need to include time when running.
I am just using it in this tutorial to give you a sense of how long
different commands run.
Load Data, Manipulate Data, and Fill Histograms
While these steps were separate in the previous workflow, they all share the same process
in this workflow. The data loading is handled by fire and we are expected to write the
code that manipulates the data and fills the histograms.
I'm going to look at the total reconstructed energy in the ECal again. Below is the updated
code file. Notice that, besides the additional #include at the top, all of the changes were
made within the function definitions.
// filename: MyAnalyzer.cxx
#include "Framework/EventProcessor.h"

#include "Ecal/Event/EcalHit.h"

class MyAnalyzer : public framework::Analyzer {
 public:
  MyAnalyzer(const std::string& name, framework::Process& p)
    : framework::Analyzer(name, p) {}
  ~MyAnalyzer() override = default;
  void onProcessStart() override;
  void analyze(const framework::Event& event) override;
};

void MyAnalyzer::onProcessStart() {
  histograms_.create(
      "total_ecal_rec_energy",
      "Total ECal Rec Energy [GeV]", 160, 0.0, 16.0
  );
}

void MyAnalyzer::analyze(const framework::Event& event) {
  const auto& ecal_rec_hits{event.getCollection<ldmx::EcalHit>("EcalRecHits","")};
  double total = 0.0;
  for (const auto& hit : ecal_rec_hits) {
    total += hit.getEnergy();
  }
  histograms_.fill("total_ecal_rec_energy", total/1000.);
}

DECLARE_ANALYZER(MyAnalyzer);
Look at the documentation of the HistogramPool
to see more examples of how to create and fill histograms.
Missing Histograms
Missing Histograms
If the output histogram file you are writing to does not receive any histograms despite
you following the above procedure, you are probably working with an older version of
ldmx-sw. In v4.5.1 ldmx-sw and earlier, you needed to include getHistoDirectory()
at the beginning of your onProcessStart function.
In order to run this code on the data, we need to compile and run the program.
The special processor_from_file function within the config script handles this in
most situations for us.
Below, you'll see that the analyzer is re-compiled into the library while
fire is loading the configuration and then the analyzer is used during event processing.
$ denv fire ana-cfg.py
---- LDMXSW: Loading configuration --------
Processor source file /home/tom/code/ldmx/website/ldmx-sw-eg/MyAnalyzer.cxx is newer than its compiled library /home/tom/code/ldmx/website/ldmx-sw-eg/libMyAnalyzer.so (or library does not exist), recompiling...
done compiling /home/tom/code/ldmx/website/ldmx-sw-eg/MyAnalyzer.cxx
---- LDMXSW: Configuration load complete  --------
---- LDMXSW: Starting event processing --------
---- LDMXSW: Event processing complete  --------
Now there is a new file hist.root in this directory which has the histogram we filled stored within it.
$ denv rootls -l hist.root
TDirectoryFile  Apr 30 22:30 2024 MyAnalyzer "MyAnalyzer"
$ denv rootls -l hist.root:*
TH1F  Apr 30 22:30 2024 MyAnalyzer_total_ecal_rec_energy  ""
In v4.5.2 of ldmx-sw, the histogram pooling was changed to avoid referencing the name of the analyzer in both the directory and the histogram itself. Before this release, the histogram would have been located at "MyAnalyzer/MyAnalyzer_total_ecal_rec_energy" but if you are using this release or newer, the same histogram would be located at "MyAnalyzer/total_ecal_rec_energy".
Plotting Histograms
Viewing the histogram with the filled data is another fork in the road.
I often switch back to the Jupyter Lab approach using uproot to load histograms from hist.root
into hist objects that I can then manipulate and plot with hist and matplotlib.
Accessing Histograms in Jupyter Lab
Accessing Histograms in Jupyter Lab
I usually hold the histogram file handle created by uproot and then use the to_hist() function
once I find the histogram I want to plot in order to pull the histogram into an object I am
familiar with. For example
f = uproot.open('hist.root')
h = f['MyAnalyzer/MyAnalyzer_total_ecal_rec_energy'].to_hist()
h.plot()
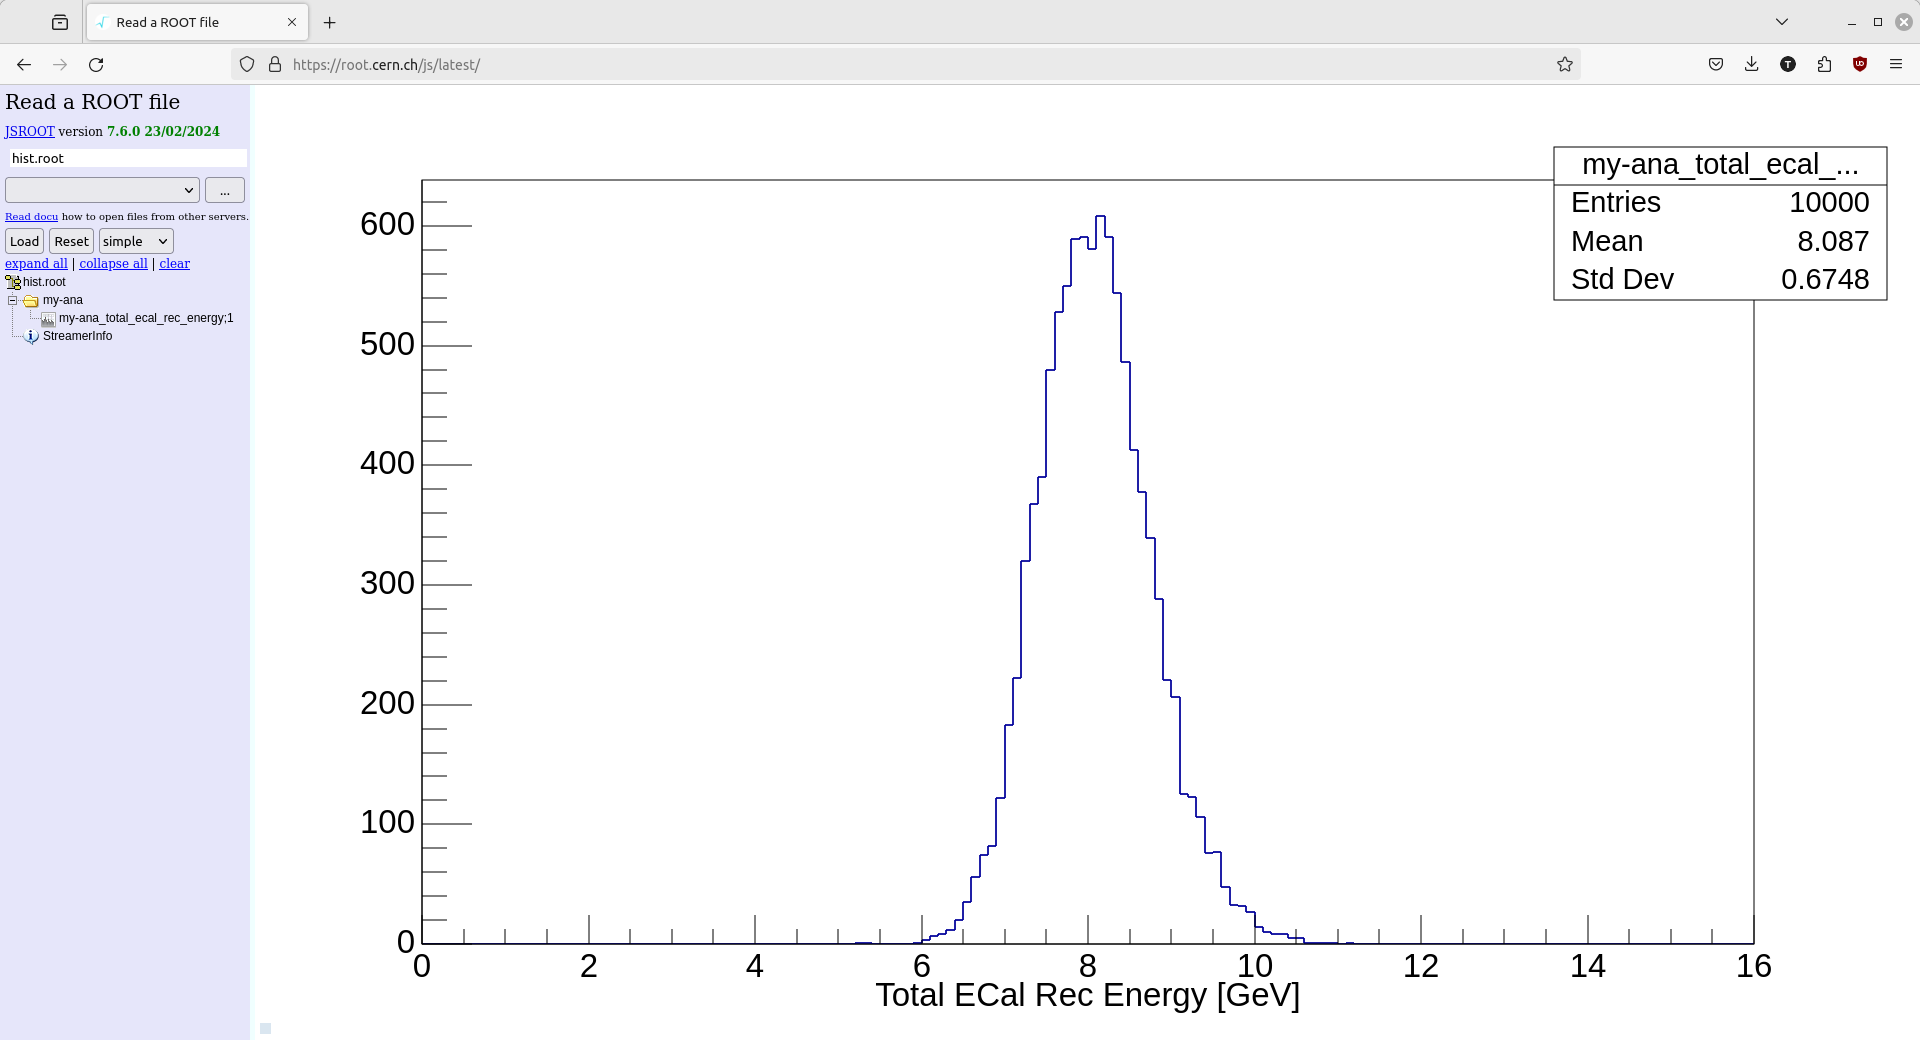
But it is also very common to view these histograms with one of ROOT's browsers.
There is a root browser within the dev images (via denv rootbrowse or ldmx rootbrowse),
but I also like to view the histogram with the online ROOT browser.
Below is a screenshot of my browser window after opening the hist.root file and then
selecting the histogram we filled.
Pre-4.0.1 Standalone Analyzers
PR #1310 goes into detail on the necessary changes, but - in large part - we can mimic the feature introduced in v4.0.1 with some additional python added into the config file.
The file below hasn't been thoroughly tested and may not work out-of-the-box. Please open a PR into this documentation if you find an issue that can be patched generally.
from pathlib import Path

class StandaloneAnalyzer:
    def __init__(self, instance_name, class_name):
        self.instanceName = instance_name
        self.className = class_name
        self.histograms = []

    @classmethod
    def from_file(cls, source_file):
        if not isinstance(source_file, Path):
            source_file = Path(source_file)
        if not source_file.is_file():
            raise ValueError(f'{source_file} is not accessible.')

        src = source_file.resolve()

        # assume class name is name of file (no extension) if not provided
        class_name = src.stem
        instance_name = class_name
        lib = src.parent / f'lib{src.stem}.so'
        if not lib.is_file() or src.stat().st_mtime > lib.stat().st_mtime:
            print(
                f'Processor source file {src} is newer than its compiled library {lib}'
                ' (or library does not exist), recompiling...'
            )
            import subprocess
            # update this path to the location of the ldmx-sw install
            # this is the correct path for production images
            ldmx_sw_install_prefix = '/usr/local'
            # for dev images, you could look at using
            #ldmx_sw_install_prefix = f'{os.environ["LDMX_BASE"]}/ldmx-sw/install'
            subprocess.run([
                'g++', '-fPIC', '-shared', # construct a shared library for dynamic loading
                '-o', str(lib), str(src), # define output file and input source file
                '-lFramework', # link to Framework library (and the event dictionary)
                '-I/usr/local/include/root', # include ROOT's non-system headers
                f'-I{ldmx_sw_install_prefix}/include', # include ldmx-sw headers
                f'-L{ldmx_sw_install_prefix}/lib', # include ldmx-sw libs
            ], check=True)
            print(f'done compiling {src}')

        ldmxcfg.Process.addLibrary(str(lib))
        instance = cls(instance_name, class_name)
        return instance

p = ldmxcfg.Process('ana')
import os
p.sequence = [ StandaloneAnalyzer.from_file('MyAnalysis.cxx') ]
p.inputFiles = [ 'events.root' ]
p.histogramFile = 'hist.root'